
Specifications

Things to Try
2-14
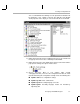
14) Before continuing to the next chapter (after completing section 2.9, page
2-14), perform the following steps to free the resources used in your
profiling session:
■
Go to the Profiler menu and uncheck Enable Clock.
■
Close the Profile Statistics window by right-clicking and choosing
Hide from the pop-up menu.
■
Go to Profiler
→
Profile-points. Select Delete All and click OK.
■
Go to the View menu and uncheck Mixed Source/ASM.
2.9 Things to Try
To further explore Code Composer Studio, try the following:
❏
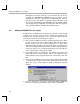
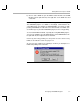
In the Build Options window, examine the fields on the Compiler,
Assembler, and Linker tabs. Choose the various Categories to see all the
options. Notice how changing the values in the field affects the command
line shown. You can see the online help to learn about the various
command line switches.
❏
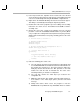
Set some breakpoints. Choose Debug
→
Breakpoints. In the Breakpoint
type box, notice that you can also set conditional breakpoints that break
only if an expression is true. You can also set a variety of hardware
breakpoints.
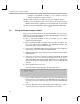
2.10 Learning More
To learn more about using Code Composer Studio, see the online help for
Code Composer Studio or the
Code Composer Studio User’s Guide
(which is
provided as an Adobe Acrobat file).