
Specifications

Profiling Code Execution Time
Developing a Simple Program
2-13
Profile-points are handled before the profile-point line is executed. They
report the number of instruction cycles since the previous profile-point or
since the program started running. As a result, the statistics for the
second profile-point report the number of cycles from when puts() started
executing until it finished executing.
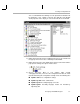
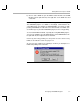
9) Choose Profiler
→
View Statistics. An area appears at the bottom of the
window that displays statistics about the profile-points.
10) Make sure the line numbers are in ascending order. If they are in the
reverse order, click the Location column heading once.
11) Resize this area by dragging its edges so you can see all the columns.
Note: Line Numbers May Vary
Line numbers displayed in this manual may vary from those displayed in the
current release of the software.
12) Click the (Run) toolbar button or press F5 to run the program. Type
an input string in the prompt window.
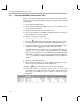
13) Notice the number of cycles shown for the second profile-point. It should
be about 1600 to 1700 cycles. (The actual numbers shown may vary.)
This is the number of cycles required to execute the call to puts().
The average, total, maximum, and minimum are the same for these
profile-points because these instructions are executed only one time.
Note: Target Halts at Profile-Points
Code Composer Studio temporarily halts the target whenever it reaches a
profile-point. Therefore, the target application may not be able to meet
real-time deadlines when you are using profile-points. (Real-time
monitoring can be performed using RTDX. See section 1.5, page 1-12.)