
Specifications

Profiling Code Execution Time
2-12
2.8 Profiling Code Execution Time
In this section, you use the profiling features of Code Composer Studio to
gather statistics about the execution of the standard puts() function. In section
3.4, page 3-8, you compare these results to the results for using the
DSP/BIOS API to display the hello world message.
1) Choose File
→
Reload Program.
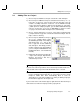
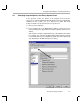
2) Choose Profiler
→
Enable Clock. A check mark appears next to this item
in the Profiler menu. This clock counts instruction cycles. It must be
enabled for profile-points to count instruction cycles.
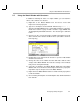
3) Double-click on the hello.c file in the Project View.
4) Choose View
→
Mixed Source/ASM. Assembly instructions are listed in
gray following each C source code line.
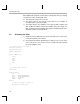
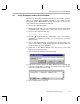
5) Put your cursor in the line that says:
puts("hello world!\n");
6) Click the (Toggle Profile-point) toolbar button. The C source code line
and the first assembly instruction are highlighted in green.
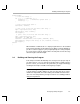
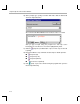
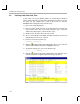
7) Scroll down and put your cursor in the line that says:
for (i = 0; i < BUFSIZE; i++) {
8) Click the (Toggle Profile-point) toolbar button. (Or, right-click on the
code line and choose Toggle Profile Pt from the pop-up menu.)