
Specifications

Using Breakpoints and the Watch Window
Developing a Simple Program
2-9
2.6 Using Breakpoints and the Watch Window
When you are developing and testing programs, you often need to check the
value of a variable during program execution. In this section, you use
breakpoints and the Watch Window to view such values. You also use the
step commands after reaching the breakpoint.
1) Choose File
→
Reload Program.
2) Double-click on the hello.c file in the Project View. You may want to make
the window larger so that you can see more of the source code at once.
3) Put your cursor in the line that says:
fprintf(fptr, "%s", scanStr);
4) Click the (Toggle Breakpoint) toolbar button or press F9. The line is
highlighted in magenta. (If you like, you can change this color using
Option
→
Color.)
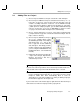
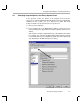
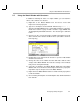
5) Choose View
→
Watch Window. A separate area in the lower-right corner
of the Code Composer Studio window appears. At run time, this area
shows the values of watched variables.
6) Right-click on the Watch Window area and choose Insert New
Expression from the pop-up list.
7) Type
*scanStr
as the Expression and click OK.
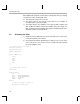
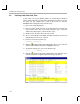
8) Notice that *scanStr is listed in the Watch Window but is undefined. This
is because the program is currently not running in the main() function
where this variable is declared locally.
9) Choose Debug
→
Run or press F5.