
Specifications

DSP/BIOS Plug-ins
1-8
1.4 DSP/BIOS Plug-ins
During the analysis phase of the software development cycle, traditional
debugging features are ineffective for diagnosing subtle problems that arise
from time-dependent interactions.
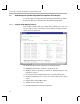
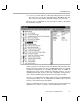
The Code Composer Studio plug-ins provided with DSP/BIOS support such
real-time analysis. You can use them to visually probe, trace, and monitor a
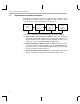
DSP application with minimal impact on real-time performance. For example,
the Execution Graph shown below displays the sequence in which various
program threads execute. (Threads is a general term used to refer to any
thread of execution. For example, hardware ISRs, software interrupts, tasks,
idle functions, and periodic functions are all threads.)
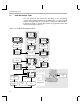
The DSP/BIOS API provides the following real-time analysis capabilities:
❏
Program tracing
. Displaying events written to target logs and reflecting
dynamic control flow during program execution
❏
Performance monitoring
. Tracking statistics that reflect the use of target
resources, such as processor loading and thread timing
❏
File streaming
. Binding target-resident I/O objects to host files
DSP/BIOS also provides a priority-based scheduler that you can choose to
use in your applications. This scheduler supports periodic execution of
functions and multi-priority threading.
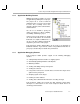
1.4.1 DSP/BIOS Configuration
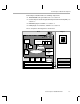
You can create configuration files in the Code Composer Studio environment
that define objects used by the DSP/BIOS API. This file also simplifies
memory mapping and hardware ISR vector mapping, so you may want to use
it even if you are not using the DSP/BIOS API.
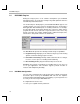
A configuration file has two roles:
❏
It lets you set global run-time parameters.