
Specifications

Using the RTDX Control to Change the Load at Run Time
6-10
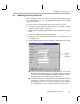
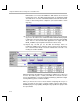
PRD statistics are measured in PRD ticks. SWI statistics are measured
in instruction cycles. The Max and Average fields for loadchange_PRD
show that there is less than a full PRD tick between the time this function
needs to start running and its completion. (The actual numbers shown
may vary.)
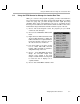
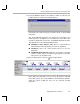
16) Use the Load Control window to gradually increase the processing load.
(If you move the slider in the Load Control window while the DSP program
is halted, the new load control values are buffered on the host by RTDX.
These have no effect until the DSP application runs again and calls
RTDX_readNB to request updated load values from the host.)
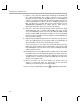
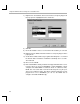
17) Repeat step 16 until you see the Max and Average values for
loadchange_PRD increase and blue squares appear in the Assertions
row of the Execution Graph. Assertions indicate that a thread is not
meeting its real-time deadline.
What is happening? The Max value for loadchange_PRD increases when you
increase the load beyond a certain point. With the increased load, the
processing_SWI takes so long to run that the loadchange_PRD cannot begin
running until long past its real-time deadline.
When you increase the load so much that the low-priority idle loop is no
longer executed, the host stops receiving real-time analysis data and the
DSP/BIOS plug-ins stop updating. Halting the target updates the plug-ins with
the queued data.