
User guide

System Generator for DSP User Guide www.xilinx.com 393
UG640 (v 12.2) July 23, 2010
Timing and Power Analysis Compilation
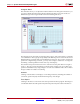
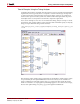
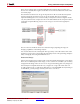
The histogram will quickly give you an estimate of the work involved. For example, look
at the histogram of the results of a simple design below:
This shows that most of the slow paths are concentrated about 1.5ns. The slowest path is
about 2.35ns. The numbers at the tops of the bins show the number of paths in each bin.
There is only one path in the bin which encompasses the time range 2.31ns-2.39ns. The bins
to the right of it are empty. This shows that the slowest path is an outlier and that if your
timing requirement were for a period of, for example, 2ns, you would need only to speed
up this single path to meet your timing requirements.