
User`s guide

28 Signal Processing Toolbox 5.1 Release Notes
28-2
New Features
This section introduces the new features added in the Signal Processing
Toolbox 5.1 since the Signal Processing Toolbox 5.0 (Release 12.0).
Enhancements are described in the next section.
For information about Signal Processing Toolbox features that are
incorporated from recent releases, see the Release Notes for Release 12.
The Signal Processing Toolbox 5.1 provides a number of new features and
enhancements, and a completely new facility for analyzing filters, the Filter
Visualization Tool.
This section is organized into the following subsections:
•“Filter Visualization Tool” on page 28-2
•“New Windows” on page 28-3
•“bitrevorder” on page 28-4
•“downsample/upsample” on page 28-4
•“filternorm” on page 28-4
•“goertzel” on page 28-4
•“New Signal Demo” on page 28-4
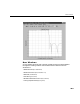
Filter Visualization Tool
The new Filter Visualization Tool (fvtool) groups all the filter analysis
functions, such as magnitude, phase, impulse response, etc., into a single
window where you can easily switch between analyses, add annotations, and
print your filter response.