
User`s guide

3 Fitting Data
3-20
difference is that the sum of sines equation includes the phase constant, and
does not include a DC offset term.
Weibull Distribution
The Weibull distribution is widely used in reliability and life (failure rate) data
analysis. The toolbox provides the two-parameter Weibull distribution
where a is the scale parameter and b is the shape parameter. Note that there
is also a three-parameter Weibull distribution with x replaced by x – c where c
is the location parameter. Additionally, there is a one-parameter Weibull
distribution where the shape parameter is fixed and only the scale parameter
is fitted. To use these distributions, you must create a custom equation.
Note that the Curve Fitting Toolbox does not fit Weibull probability
distributions to a sample of data. Instead, it fits curves to response and
predictor data such that the curve has the same shape as a Weibull
distribution.
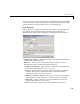
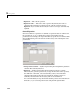
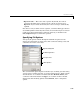
Custom Equations
If the toolbox library does not contain the desired parametric equation, you
must create your own custom equation. However, if possible, you should use
the library equations because they offer the best chance for rapid convergence.
This is because
• For most models, optimal default coefficient starting points are calculated.
For custom equations, the default starting points are chosen at random on
the interval [0,1]. Refer to “Default Coefficient Parameters” on page 3-26 for
more information.
• An analytic Jacobian is used instead of finite differencing.
• When using the Analysis GUI, analytic derivatives are calculated as well as
analytic integrals if the integral can be expressed in closed form.
Note To save custom equations for later use, you should save the
curve-fitting session with the File-> Save Session menu item.
yabx
b 1–
e
ax
b
–
=