
User`s guide

Parametric Fitting
3-13
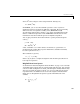
4 If the fit converges, then you are done. Otherwise, perform the next iteration
of the fitting procedure by returning to the first step.
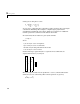
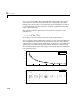
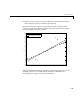
The plot shown below compares a regular linear fit with a robust fit using
bisquare weights. Notice that the robust fit follows the bulk of the data and is
not strongly influenced by the outliers.
Instead of minimizing the effects of outliers by using robust regression, you can
mark data points to be excluded from the fit. Refer to “Excluding and
Sectioning Data” on page 2-25 for more information.
0 2 4 6 8 10 12 14 16 18 20
−5
0
5
10
15
20
25
30
x
y
Data
Regular linear fit
Robust fit w/bisquare weights