
User`s guide

3 Fitting Data
3-10
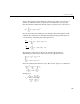
where w
i
are the weights. The weights determine how much each response
value influences the final parameter estimates. A high-quality data point
influences the fit more than a low-quality data point. Weighting your data is
recommended if the weights are known, or if there is justification that they
follow a particular form.
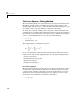
The weights modify the expression for the parameter estimates b in the
following way,
where W is given by the diagonal elements of the weight matrix w.
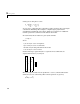
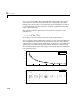
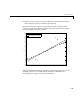
You can often determine whether the variances are not constant by fitting the
data and plotting the residuals. In the plot shown below, the data contains
replicate data of various quality and the fit is assumed to be correct. The poor
quality data is revealed in the plot of residuals, which has a “funnel” shape
where small predictor values yield a bigger scatter in the response values than
large predictor values.
b β
ˆ
X
T
WX()
1–
X
T
Wy==
0 1 2 3 4 5 6
0
20
40
60
80
100
x
y
data
fitted curve
0 1 2 3 4 5 6
−15
−10
−5
0
5
10
15
residuals