
User`s guide

3
Fitting Data
Curve fitting refers to fitting curved lines to data. The curved line comes from regression techniques,
a spline calculation, or interpolation. The data can be measured from a sensor, generated from a
simulation, historical, and so on. The goal of curve fitting is to gain insight into your data. The insight
will enable you to improve data acquisition techniques for future experiments, accept or refute a
theoretical model, extract physical meaning from fitted coefficients, and draw conclusions about the
data’s parent population.
This chapter describes how to fit data and evaluate the goodness of fit with the Curve Fitting Toolbox.
The sections are as follows.
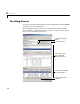
The Fitting Process (p. 3-2) The general steps you use when fitting any data set.
Parametric Fitting (p. 3-4) Fit your data using parametric models such as polynomials and
exponentials, specify fit options such as the fitting algorithm and
coefficient starting points, and evaluate the goodness of fit using
graphical and numerical techniques.
Parametric fitting produces coefficients that describe the data globally,
and often have physical meaning.
Nonparametric Fitting
(p. 3-68)
Fit your data using nonparametric fit types such as splines and
interpolants.
Nonparametric fitting is useful when you want to fit a smooth curve
through your data, and you are not interested in interpreting fitted
coefficients.
Selected Bibliography
(p. 3-75)
Resources for additional information.