
User`s guide

Excluding and Sectioning Data
2-33
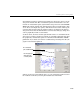
To mark data points for exclusion in the GUI, place the mouse cursor over the
data point and left-click. The excluded data point is marked with a red
X. To
include an excluded data point, right-click the data point or select the
Include
Them
radio button and left-click. Included data points are marked with a blue
circle. To select multiple data points, click the left mouse button and drag the
selection rubber band so that the rubber band box encompasses the desired
data points. Note that the GUI identifies sectioned data with gray strips. You
cannot graphically include sectioned data.
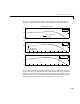
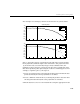
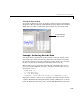
As shown below, the first and last eight months of data are excluded from the
data set by sectioning, and the two outliers are excluded graphically. Note that
the graphically excluded data points are identified in the
Check to exclude
point
table. If you decide to include an excluded data point using the table, the
graph is automatically updated.
If there are fits associated with the data, you can exclude data points based on
the residuals of the fit by selecting the residual data in the
Y list.
The vertical gray strips
indicate data points
sectioned by domain.
The x’s indicate data
points excluded manually.