
User`s guide

2 Importing, Viewing, and Preprocessing Data
2-32
Example: Excluding and Sectioning Data
This example modifies the ENSO data set to illustrate excluding and
sectioning data. First, copy the ENSO response data to a new variable and add
two outliers that are far removed from the bulk of the data.
rand('state',0)
yy = pressure;
yy(ceil(length(month)*rand(1))) = mean(pressure)*2.5;
yy(ceil(length(month)*rand(1))) = mean(pressure)*3.0;
Import the variables month and yy as the new data set enso1, and open the
Exclude GUI.
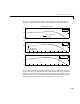
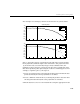
Assume that the first and last eight months of the data set are unreliable, and
should be excluded from subsequent fits. The simplest way to exclude these
data points is to section the predictor data. To do this, specify the range of data
you want to include in the
Exclude X outside of field of the Section pane.
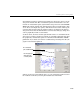
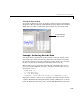
There are two ways to exclude individual data points: using the
Check to
exclude point
table or graphically. For this example, the simplest way to
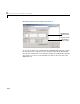
exclude the outliers is graphically. To do this, select the data set name and click
the
Exclude graphically button, which opens the Select Points for Exclusion
Rule GUI.
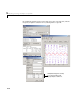
Data points outside the
specified domain are
marked for exclusion.
Select the data set.
Open the GUI to exclude
data points graphically.