
User`s guide

Excluding and Sectioning Data
2-31
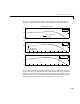
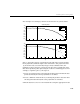
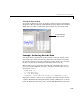
Two examples of sectioning by domain are shown below for generated data.
Plot
(a) shows the data set sectioned by fit type. The left section is fit with a
linear polynomial, while the right section is fit with a cubic polynomial. Plot
(b) shows the data set sectioned by fit type and by valid data. Here, the
rightmost section is not part of any fit because the data is corrupted by noise.
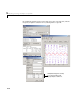
Note that reproducing these plots using the toolbox is a multistep process. For
example, to reproduce plot (a), the steps are
1 Create an exclusion rule by sectioning the predictor data such that the data
points described by the linear polynomial are excluded.
2 Create a different exclusion rule by sectioning the predictor data such that
the data points described by the cubic polynomial are excluded.
3 Fit the data twice (once for each exclusion rule) using the appropriate model.
0 2 4 6 8 10 12 14 16 18 20
1200
1000
−800
−600
−400
−200
0
200
400
(a)
Sectioning Data
data
linear fit
cubic fit
0 2 4 6 8 10 12 14 16 18 20
1200
1000
−800
−600
−400
−200
0
200
400
(b)
data
linear fit
cubic fit