
User`s guide

Excluding and Sectioning Data
2-29
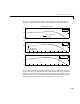
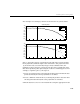
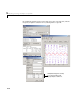
Two types of influential data points are shown below for generated data. Also
shown are cubic polynomial fits and a robust fit that is resistant to outliers.
Plot
(a) shows that the two influential data points are outliers and adversely
affect the fit. Plot
(b) shows that the two influential data points are consistent
with the model and do not adversely affect the fit. Plot
(c) shows that a robust
fitting procedure is an acceptable alternative to marking outliers for exclusion.
Robust fitting is described in “Robust Least Squares” on page 3-11.
0 1 2 3 4 5 6 7 8 9 10
50
100
150
(a)
Influential Data Points
data
cubic fit
0 1 2 3 4 5 6 7 8 9 10
50
100
150
(c)
data
robust cubic fit
0 1 2 3 4 5 6 7 8 9 10
50
100
150
(b)
data
cubic fit
These outliers adversely
affect the fit.
These data points are
consistent with the model.