
User`s guide

2 Importing, Viewing, and Preprocessing Data
2-20
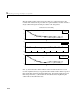
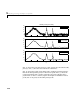
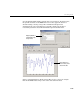
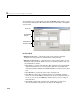
Plot (a) shows the noisy data. To more easily compare the smoothed results,
plots
(b) and (c) show the data without the added noise.
Plot
(b) shows the result of smoothing with a quadratic polynomial. Notice
that the method performs poorly for the narrow peaks. Plot
(c) shows the
result of smoothing with a quartic polynomial. In general, higher degree
polynomials can more accurately capture the heights and widths of narrow
peaks, but can do poorly at smoothing wider peaks.
1 2 3 4 5 6 7 8
0
20
40
60
80
Savitzky−Golay Smoothing
(a)
noisy data
1 2 3 4 5 6 7 8
0
20
40
60
80
(b)
data
S−G quadratic
1 2 3 4 5 6 7 8
0
20
40
60
80
(c)
data
S−G quartic