
User`s guide

2 Importing, Viewing, and Preprocessing Data
2-18
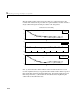
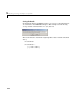
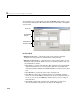
The smoothing results of the lowess procedure are compared below to the
results of the robust lowess procedure for a generated data set that contains a
single outlier. The span for both procedures is 11 data points.
Plot
(a) shows that the outlier influences the smoothed value for several
nearest neighbors. Plot
(b) suggests that the residual of the outlier is greater
than six median absolute deviations. Therefore, the robust weight is zero for
this data point. Plot
(c) shows that the smoothed values neighboring the
outlier reflect the bulk of the data.
0 1 2 3 4 5 6
−5
0
5
(b)
residuals
0 1 2 3 4 5 6
0
5
10
(c)
data
robust lowess
0 1 2 3 4 5 6
0
5
10
Robust Lowess Smoothing
(a)
data
lowess