
User`s guide

Smoothing Data
2-13
Note that y
s
(1), y
s
(2), ... ,y
s
(end) refer to the order of the data after sorting,
and not necessarily the original order.
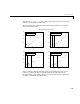
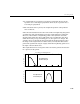
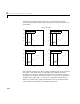
The smoothed values and spans for the first four data points of a generated
data set are shown below.
Plot
(a) indicates that the first data point is not smoothed because a span
cannot be constructed. Plot
(b) indicates that the second data point is
smoothed using a span of three. Plots
(c) and (d) indicate that a span of five
is used to calculate the smoothed value.
0 2 4 6 8
0
20
40
60
80
Moving Average Smoothing
(a)
Data
Smoothed value
0 2 4 6 8
0
20
40
60
80
(b)
Data
Smoothed value
0 2 4 6 8
0
20
40
60
80
(c)
Data
Smoothed value
0 2 4 6 8
0
20
40
60
80
(d)
Data
Smoothed value