
User`s guide
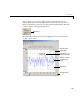

Smoothing Data
2-11
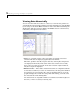
Data Sets
• Original data set — Select the data set you want to smooth.
•
Smoothed data set — Specify the name of the smoothed data set. Note that
the process of smoothing the original data set always produces a new data
set containing smoothed response values.
Smoothing Method and Parameters
• Method — Select the smoothing method. Each response value is replaced
with a smoothed value that is calculated by the specified smoothing method.
-
Moving average — Filter the data by calculating an average.
-
Lowess — Locally weighted scatter plot smooth using linear least squares
fitting and a first-degree polynomial.
-
Loess — Locally weighted scatter plot smooth using linear least squares
fitting and a second-degree polynomial.
-
Savitzky-Golay — Filter the data with an unweighted linear least
squares fit using a polynomial of the specified degree.
-
Robust Lowess — Lowess method that is resistant to outliers.
-
Robust Loess — Loess method that is resistant to outliers.
•
Span — The number of data points used to compute each smoothed value.
For the moving average and Savitzky-Golay methods, the span must be odd.
For all locally weighted smoothing methods, if the span is less than 1, it is
interpreted as the percentage of the total number of data points.
•
Degree — The degree of the polynomial used in the Savitzky-Golay method.
The degree must be smaller than the span.
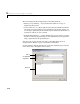
Data Sets List
• Smoothed data sets — Lists all the smoothed data sets. You add a smoothed
data set to the list by clicking the
Create smoothed data set button. When
you select a data set from the list, you can perform these actions:
- Click
View to open the View Data Set GUI. Using this GUI, you can view
a single data set both graphically and numerically. Additionally, you can
display data points to be excluded in a fit by selecting an exclusion rule.
- Click
Rename to change the name of a single data set.