
User`s guide
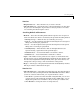

Viewing Data
2-7
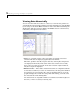
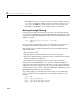
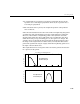
You can change the color, line width, line style, and marker type of the
displayed data points using the right-click menu shown below. You activate
this menu by placing your mouse over a data point and right-clicking. Note that
a similar menu is available for fitted curves.
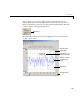
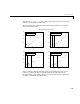
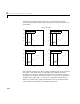
The ENSO data is shown below after the display has been enhanced using
several of these tools.
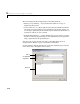
Right-click menu
Display data tips for the
maximum response value.
Display the legend for
the ENSO data set.
Change the color, marker
type and line style for
the data.
Change the axis limits.
Display the grid.