
User`s guide

2
Importing, Viewing, and
Preprocessing Data
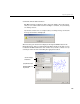
This chapter describes how to import, view, and preprocess data with the Curve Fitting Toolbox. You
import data with the Data GUI, and view data graphically as a scatter plot using the Curve Fitting
Tool. The main preprocessing steps are smoothing, and excluding and sectioning data. You smooth
data with the Data GUI, and exclude and section data with the Exclude GUI. The sections are as
follows.
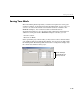
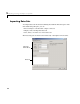
Importing Data Sets
(p. 2-2)
Select workspace variables that compose the data set, list all imported
and generated data sets, and delete one or more data sets.
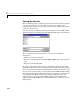
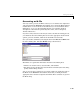
Viewing Data (p. 2-6) View the data graphically as a scatter plot.
Smoothing Data (p. 2-9) Reduce noise in a data set using moving average filtering, lowess or
robust lowess, loess or robust loess, or Savitzky-Golay filtering.
Excluding and Sectioning
Data (p. 2-25)
Mark individual data points (outliers) to be excluded from a fit, or mark
a range of data points (sectioning) to be excluded from a fit.
Additional Preprocessing
Steps (p. 2-40)
Additional preprocessing steps not available through the Data GUI,
such as transforming the response data and removing
Infs, NaNs, and
outliers from a data set.
Selected Bibliography
(p. 2-42)
Resources for additional information.