
User`s guide

Analyzing the Fit
1-15
Analyzing the Fit
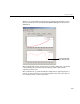
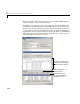
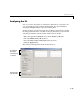
You can evaluate (interpolate or extrapolate), differentiate, or integrate a fit
over a specified data range with the Analysis GUI. You open this GUI by
clicking the
Analysis button on the Curve Fitting Tool.
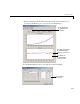
For this example, you will extrapolate the quadratic polynomial fit to predict
the US population from the year 2000 to the year 2050 in 10 year increments,
and then plot both the analysis results and the data. To do this:
• Enter the appropriate MATLAB vector in the
Analyze at Xi field.
• Select the
Evaluate fit at Xi check box.
• Select the
Plot results and Plot data set check boxes.
• Click the
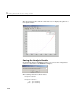
Apply button.
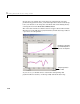
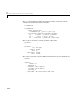
The numerical extrapolation results are shown below.
Specify the fit and
data to analyze.
Select this check box
to extrapolate.
Plot both the analysis
results and the data.