
User`s guide

Fitting the Data
1-11
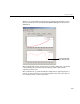
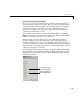
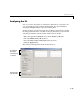
Examining the Numerical Fit Results
Because you can no longer eliminate fits by examining them graphically, you
should examine the numerical fit results. There are two types of numerical fit
results displayed in the Fitting GUI: goodness of fit statistics and confidence
intervals on the fitted coefficients. The goodness of fit statistics help you
determine how well the curve fits the data. The confidence intervals on the
coefficients determine their accuracy.
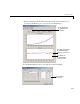
Some goodness of fit statistics are displayed in the
Results area of the Fit
Editor
for a single fit. All goodness of fit statistics are displayed in the Table
of Fits
for all fits, which allows for easy comparison.
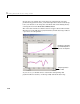
In this example, the sum of squares due to error (SSE) and the adjusted
R-square statistics are used to help determine the best fit. As described in
“Goodness of Fit Statistics” on page 3-29, the SSE statistic is the least squares
error of the fit, with a value closer to zero indicating a better fit. The adjusted
R-square statistic is generally the best indicator of the fit quality when you add
additional coefficients to your model.
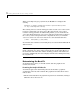
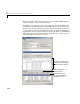
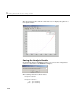
You can modify the information displayed in the
Table of Fits with the Table
Options GUI. You open this GUI by clicking the
Table options button on the
Fitting GUI. As shown below, select the adjusted R-square statistic and clear
the R-square statistic.
Do not display the R-square
statistic in the
Table of Fits.
Display the adjusted R-square
statistic in the
Table of Fits.