
User`s guide

Fitting the Data
1-7
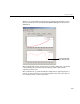
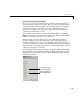
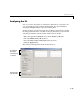
The data, fit, and residuals are shown below. You display the residuals as a line
plot by selecting the menu item
View->Residuals->Line plot from the Curve
Fitting Tool.
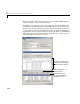
The residuals indicate that a better fit may be possible. Therefore, you should
continue fitting the census data following the procedure outlined in the
beginning of this section.
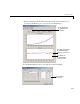
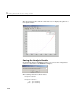
The residuals from a good fit should look random with no apparent pattern. A
pattern, such as a tendency for consecutive residuals to have the same sign, can
be an indication that a better model exists.
These residuals indicate that
a better fit may be possible.