
User`s guide

predint
4-125
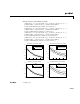
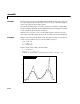
Plot the data, fit, and confidence bounds.
subplot(2,2,1), plot(fresult,x,y), hold on, plot(x,c1,'k-.')
legend('data','fitted curve','prediction bounds')
title('Nonsimultaneous bounds for function')
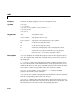
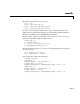
subplot(2,2,3), plot(fresult,x,y), hold on, plot(x,c2,'k-.')
legend('data','fitted curve','prediction bounds')
title('Simultaneous bounds for function')
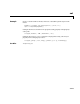
subplot(2,2,2), plot(fresult,x,y), hold on; plot(x,c3,'k-.')
legend('data','fitted curve','prediction bounds')
title('Nonsimultaneous bounds for observation')
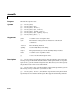
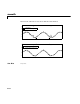
subplot(2,2,4), plot(fresult,x,y), hold on, plot(x,c4,'k-.')
legend('data','fitted curve','prediction bounds')
title('Simultaneous bounds for observation')
See Also confint, fit
0 2 4 6 8 10
0
0.5
1
1.5
2
2.5
x
y
Nonsimultaneous bounds for function
data
fitted curve
prediction bounds
0 2 4 6 8 10
0
0.5
1
1.5
2
2.5
x
y
Simultaneous bounds for function
data
fitted curve
prediction bounds
0 2 4 6 8 10
−0.5
0
0.5
1
1.5
2
2.5
x
y
Nonsimultaneous bounds for observation
data
fitted curve
prediction bounds
0 2 4 6 8 10
−0.5
0
0.5
1
1.5
2
2.5
x
y
Simultaneous bounds for observation
data
fitted curve
prediction bounds