User`s guide
Manuals
Brands
MATLAB Manuals
Other
CURVE FITTING TOOLBOX - RELEASE NOTES
191
192
193
194
195
196
197
198
199
200
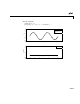
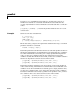
plot
4-121
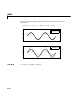
Plot t
he resid
uals.
subplot(2,1,2)
plot(fit1,'k-',x,y,'b.','
residuals');
−
8
−
6
−
4
−
2
0
2
4
6
8
−
1.5
−
1
−
0.5
0
0.5
1
1.5
2
x
y
data
excluded data
fitted curve
−
8
−
6
−
4
−
2
0
2
4
6
8
−
0.5
0
0.5
1
1.5
2
x
y residual
data
zero line
1
...
...
195
196
197
198
199
...
...
216