
User`s guide

plot
4-120
plot(...,'ptype1','ptype2',...,conflev) plots prediction bounds with
the confidence level specified by
conflev. conflev must be between 0 and 1.
The default value is 0.95 for 95% confidence levels.
h = plot(…) returns a vector of handles to h.
Remarks To plot error bars, use the errorbar function. For example, if you have a vector
of weights
w (reciprocal variances) associated with the response data ydata, you
can plot symmetric error bars with the following command.
errorbar(xdata,ydata,1./sqrt(w))
Example Create a noisy sine wave on the interval [-2π, 2π] and add two outliers with the
value 2.
rand('state',2);
x = (-2*pi:0.1:2*pi)';
y = sin(x) + (rand(size(x))-0.5)*0.2;
y(ceil(length(x)*rand(2,1))) = 2;
Identify outliers that are outside the interval [-1.5, 1.5] using the range
method.
outliers = excludedata(x,y,'range',[-1.5 1.5]);
Create a custom fit type, define fit options that exclude the outliers from the fit
and define reasonable starting values, and fit the data.
ftype = fittype('a*sin(b*x)');
opts = fitoptions('Method','NonLinear','excl',outliers,...
'Start',[1 1]);
fit1 = fit(x,y,ftype,opts);
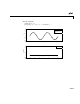
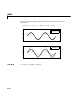
Plot the data, the fit to the data, and mark the outliers.
subplot(2,1,1)
plot(fit1,'k-',x,y,'b.',outliers,'ro');