
User`s guide

plot
4-119
plot(fresult,'s1',xdata,ydata,'s2') plots the fit result object using the
color, symbol, and line type specified by the string
s1, and plots the predictor
and response data using the color, symbol, and line type specified by the string
s2.
plot(fresult,xdata,ydata,outliers) plots the outliers specified by
outliers in a different color. outliers must be the same size as xdata and
ydata. You identify data points as outliers with the excludedata function.
plot(fresult,xdata,ydata,outliers,'s') plots the outliers using the color,
symbol, and line type specified by the string
s.
plot(...,'ptype1','ptype2',...) plots the plot types specified by ptype1,
ptype2, and so on. ptype can be a single plot type or multiple plot types, which
you can specify as a cell array of strings. For one plot type or none (the default),
plot behaves like the built-in plot command and draws into the current figure
and axes. This way, you can use commands like
subplot and hold to arrange
plots in a figure window and to superimpose multiple fits into the same graph.
For multiple plot types,
plot uses subplot to create one set of axes per plot
type. The supported plot types are given below.
Plot Type Description
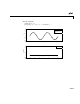
fit
Plot the data and the fit (default).
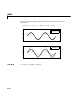
predfunc Same as fit but with prediction bounds for the function.
predobs Same as fit but with prediction bounds for a new
observation.
residuals Plot the residuals. The fit corresponds to the zero line.
stresiduals Plot the standardized residuals. The fit corresponds to the
zero line. Standardized residuals are the ordinary residuals
divided by their standard deviation. Standardizing puts all
residuals on a common scale (units of standard deviations)
and makes it easier to quantify how far a point is from the
fitted curve.