
User`s guide

Fitting the Data
1-5
Fitting the Data
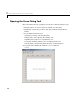
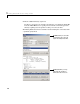
You fit data with the Fitting GUI. You open this GUI by clicking the Fitting
button on the Curve Fitting Tool. The Fitting GUI consists of two parts: the
Fit
Editor
and the Table of Fits. The Fit Editor allows you to
• Specify the fit name, the current data set, and the exclusion rule.
• Explore various fits to the current data set using a library or custom
equation, a smoothing spline, or an interpolant.
• Override the default fit options such as the coefficient starting values.
• Compare fit results including the fitted coefficients and goodness of fit
statistics.
The
Table of Fits allows you to
• Keep track of all the fits and their data sets for the current session.
• Display a summary of the fit results.
• Save or delete the fit results.
The Data Fitting Procedure
For this example, begin by fitting the census data with a second degree
polynomial. Then continue fitting the data using polynomial equations up to
sixth degree, and a single-term exponential equation.
The data fitting procedure follows these general steps:
1 From the Fit Editor, click New Fit.
Note that this action always defaults to a linear polynomial fit type. You use
New Fit at the beginning of your curve fitting session, and when you are
exploring different fit types for a given data set.
2 Because the initial fit uses a second degree polynomial, select quadratic
polynomial
from the Polynomial list. Name the fit poly2.
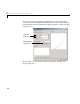
3 Click the Apply button or select the Immediate apply check box. The
library model, fitted coefficients, and goodness of fit statistics are displayed
in the
Results area.