
User`s guide

cftool
4-85
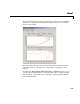
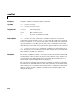
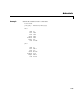
The Curve Fitting Tool is shown below. The data is from the census MAT-file,
and the fit is a quadratic polynomial. The residuals are shown as a line plot
below the data and fit.
The Curve Fitting Tool provides several features that facilitate data and fit
exploration. Refer to “Viewing Data” on page 2-6 for a description of these
features.
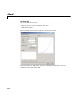
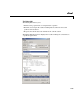
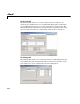
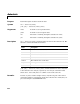
By clicking the
Data, Fitting, Exclude, Plotting, or Analysis buttons, you can
open the associated GUIs, which are described below. For a complete example
that uses many of these GUIs, refer to Chapter 1, “Getting Started with the
Curve Fitting Toolbox.”