
User`s guide

3 Fitting Data
3-56
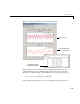
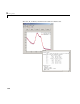
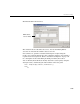
The fit, residuals, and numerical results are shown below.
The fit is an improvement over the previous two fits, and appears to account
for most of the cycles present in the ENSO data set. The residuals appear
random for most of the data, although a pattern is still visible indicating that
additional cycles may be present, or you can improve the fitted amplitudes.
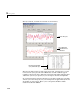
In conclusion, Fourier analysis of the data reveals three significant cycles. The
annual cycle is the strongest, but cycles with periods of approximately 44 and
22 months are also present. These cycles correspond to El Nino and the
Southern Oscillation (ENSO).
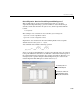
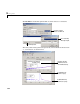
The fit for three cycles.
The residuals appear
fairly random for most
of the data set.
The numerical results indicate
12, 22, and 44 month cycles.