
User`s guide

Preface
x
Documentation Examples and Data Sets
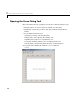
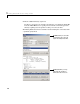
To learn how to use the Curve Fitting Toolbox, you can follow the examples
included in this guide. A quick way to locate these examples is with the
example index, which you can access via the Help browser.
Some examples use data that is generated as part of the example, while other
examples use data sets that are included with the toolbox or with MATLAB.
These data sets are stored as MAT-files and are listed below.
The
enso, gauss3, and hahn1 data sets were obtained from the Statistical
Reference Datasets collection, which is provided by the Information
Technology Laboratory
of the National Institute of Standards and Technology.
The Web site is
http://www.itl.nist.gov/div898/strd.
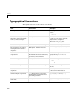
Data Set Description
carbon12alpha
Generated data associated with the nuclear reaction
12
C(e,e’,α)
8
Be. The data set is based on the experiment
described by reference [8] in Chapter 3, “Fitting Data.”
census United States population figures for the years 1790 to
1990 in 10-year increments. The data set is included
with MATLAB.
enso Measured data of monthly averaged atmospheric
pressure differences between Easter Island and Darwin,
Australia.
flvote2k 2000 U. S. presidential election results for the state of
Florida. The data set was obtained from
http://election.dos.state.fl.us/.
gauss3 Generated data consisting of two poorly resolved
Gaussian peaks on an exponential background.
hahn1 Measured data of the thermal expansion of copper as a
function of temperature.