
User`s guide

Parametric Fitting
3-39
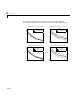
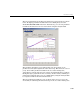
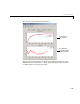
The 95% nonsimultaneous prediction bounds for new observations are shown
below. To display prediction bounds in the Curve Fitting Tool, select the
View->Prediction Bounds menu item. Alternatively, you can view prediction
bounds for the function or for new observations using the Analysis GUI.
The prediction bounds for
poly3 indicate that new observations can be
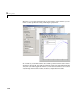
predicted accurately throughout the entire data range. This is not the case for
poly5. It has wider prediction bounds in the area of the missing data,
apparently because the data does not contain enough information to estimate
the higher degree polynomial terms accurately. In other words, a fifth-degree
polynomial overfits the data. You can confirm this by using the Analysis GUI
to compute bounds for the functions themselves.
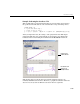
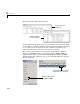
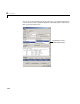
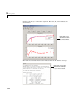
The 95% prediction bounds for
poly5 are shown below. As you can see, the
uncertainty in estimating the function is large in the area of the missing data.