
User`s guide

3 Fitting Data
3-36
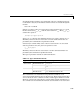
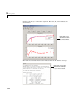
are wider than the fitted function intervals because of the additional
uncertainty in predicting a new response value (the fit plus random errors).
0 2 4 6 8 10
0
0.5
1
1.5
2
2.5
x
y
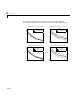
Nonsimultaneous bounds for function
data
fitted curve
prediction bounds
0 2 4 6 8 10
0
0.5
1
1.5
2
2.5
x
y
Simultaneous bounds for function
data
fitted curve
prediction bounds
0 2 4 6 8 10
−0.5
0
0.5
1
1.5
2
2.5
x
y
Nonsimultaneous bounds for observation
data
fitted curve
prediction bounds
0 2 4 6 8 10
−0.5
0
0.5
1
1.5
2
2.5
x
y
Simultaneous bounds for observation
data
fitted curve
prediction bounds