
User`s guide

3 Fitting Data
3-32
Confidence and Prediction Bounds
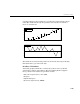
With the Curve Fitting Toolbox, you can calculate confidence bounds for the
fitted coefficients, and prediction bounds for new observations or for the fitted
function. Additionally, for prediction bounds, you can calculate simultaneous
bounds, which take into account all predictor values, or you can calculate
nonsimultaneous bounds, which take into account only individual predictor
values. The confidence bounds are numerical, while the prediction bounds are
displayed graphically.
The available confidence and prediction bounds are summarized below.
Note Prediction bounds are often described as confidence bounds because
you are calculating a confidence interval for a predicted response.
Confidence and prediction bounds define the lower and upper values of the
associated interval, and define the width of the interval. The width of the
interval indicates how uncertain you are about the fitted coefficients, the
predicted observation, or the predicted fit. For example, a very wide interval
for the fitted coefficients can indicate that you should use more data when
fitting before you can say anything very definite about the coefficients.
The bounds are defined with a level of certainty that you specify. The level of
certainty is often 95%, but it can be any value such as 90%, 99%, 99.9%, and so
on. For example, you might want to take a 5% chance of being incorrect about
predicting a new observation. Therefore, you would calculate a 95% prediction
interval. This interval indicates that you have a 95% chance that the new
observation is actually contained within the lower and upper prediction
bounds.
Table 3-2: Types of Confidence and Prediction Bounds
Interval Type Description
Fitted coefficients Confidence bounds for the fitted coefficients
New observation Prediction bounds for a new observation (response
value)
New function Prediction bounds for a new function value