
User`s guide

Parametric Fitting
3-29
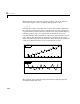
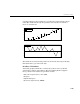
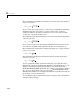
A graphical display of the residuals for a second-degree polynomial fit is shown
below. The model includes only the quadratic term, and does not include a
linear or constant term.
The residuals are systematically positive for much of the data range indicating
that this model is a poor fit for the data.
Goodness of Fit Statistics
After using graphical methods to evaluate the goodness of fit, you should
examine the goodness of fit statistics. The Curve Fitting Toolbox supports
these goodness of fit statistics for parametric models:
• The sum of squares due to error (SSE)
• R-square
• Adjusted R-square
• Root mean squared error (RMSE)
0 1 2 3 4 5 6 7 8 9 10 11
0
2
4
6
8
10
12
Data
Quadratic Fit
0 1 2 3 4 5 6 7 8 9 10 11
−3
−2
−1
0
1
2
3
Residuals