
User`s guide

3 Fitting Data
3-28
Mathematically, the residual for a specific predictor value is the difference
between the response value y and the predicted response value .
Assuming the model you fit to the data is correct, the residuals approximate
the random errors. Therefore, if the residuals appear to behave randomly, it
suggests that the model fits the data well. However, if the residuals display a
systematic pattern, it is a clear sign that the model fits the data poorly.
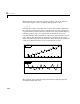
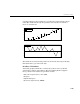
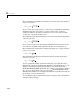
A graphical display of the residuals for a first degree polynomial fit is shown
below. The top plot shows that the residuals are calculated as the vertical
distance from the data point to the fitted curve. The bottom plot shows that the
residuals are displayed relative to the fit, which is the zero line.
The residuals appear randomly scattered around zero indicating that the
model describes the data well.
y
ˆ
ryy
ˆ
–=
0 1 2 3 4 5 6 7 8 9 10 11
0
2
4
6
8
10
12
Data
Linear Fit
0 1 2 3 4 5 6 7 8 9 10 11
−3
−2
−1
0
1
2
3
Residuals