
User`s guide
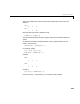
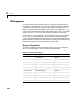
Table Of Contents
- Preface
- Quick Start
- LTI Models
- Introduction
- Creating LTI Models
- LTI Properties
- Model Conversion
- Time Delays
- Simulink Block for LTI Systems
- References
- Operations on LTI Models
- Arrays of LTI Models
- Model Analysis Tools
- The LTI Viewer
- Introduction
- Getting Started Using the LTI Viewer: An Example
- The LTI Viewer Menus
- The Right-Click Menus
- The LTI Viewer Tools Menu
- Simulink LTI Viewer
- Control Design Tools
- The Root Locus Design GUI
- Introduction
- A Servomechanism Example
- Controller Design Using the Root Locus Design GUI
- Additional Root Locus Design GUI Features
- References
- Design Case Studies
- Reliable Computations
- Reference
- Category Tables
- acker
- append
- augstate
- balreal
- bode
- c2d
- canon
- care
- chgunits
- connect
- covar
- ctrb
- ctrbf
- d2c
- d2d
- damp
- dare
- dcgain
- delay2z
- dlqr
- dlyap
- drmodel, drss
- dsort
- dss
- dssdata
- esort
- estim
- evalfr
- feedback
- filt
- frd
- frdata
- freqresp
- gensig
- get
- gram
- hasdelay
- impulse
- initial
- inv
- isct, isdt
- isempty
- isproper
- issiso
- kalman
- kalmd
- lft
- lqgreg
- lqr
- lqrd
- lqry
- lsim
- ltiview
- lyap
- margin
- minreal
- modred
- ndims
- ngrid
- nichols
- norm
- nyquist
- obsv
- obsvf
- ord2
- pade
- parallel
- place
- pole
- pzmap
- reg
- reshape
- rlocfind
- rlocus
- rltool
- rmodel, rss
- series
- set
- sgrid
- sigma
- size
- sminreal
- ss
- ss2ss
- ssbal
- ssdata
- stack
- step
- tf
- tfdata
- totaldelay
- zero
- zgrid
- zpk
- zpkdata
- Index

Creating LTI Models
2-19
For example, the MAT-file LTIexamples.mat contains a frequency vector freq,
and a corresponding complex frequency response data vector
respG.Toload
this frequency-domain data and construct an FRD model, type
load LTIexamples
sys = frd(respG,freq)
Continuous-time frequency response with 1 output and 1 input
at 5 frequency points.
From input 1 to:
Frequency(rad/s) output 1
---------------- --------
1 –0.812505 –0.000312i
2 –0.092593 –0.462963i
4 –0.075781 –0.001625i
5 –0.043735 –0.000390i
ThesyntaxforcreatingaMIMOFRDmodelisthesameasfortheSISOcase,
exceptthat
response is a p-by-m-by-N
f
multidimensional array, where p is the
number of outputs, m is the number of inputs, and N
f
is the number of
frequency d ata points (the length of
frequency).
The following table summarizes the complex-valued response data format for
FRD models.
Table 2-3: Data Format for the Argument response in FRD Models
Model Form Response Data Format
SISO model Vector of length Nf for which response(i) is the
frequency response at the frequency
frequency(i)
MIMO model
with
Ny outputs
and
Nu inputs
Ny-by-Nu-by-Nf multidimensional array for which
response(i,j,k) specifies the frequency response
from input
j to output i at frequency frequency(k)
S1
-by-...-by-Sn
array of models
with
Ny outputs
and
Nu inputs
Ny-by-Nu-by-S1-by-...-by-Sn multidimensional array,
for which
response(i,j,k,:) specifies the array of
frequency response data from input
j to output i at
frequency
frequency(k)