
User`s guide
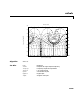
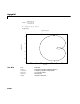
Table Of Contents
- Preface
- Quick Start
- LTI Models
- Introduction
- Creating LTI Models
- LTI Properties
- Model Conversion
- Time Delays
- Simulink Block for LTI Systems
- References
- Operations on LTI Models
- Arrays of LTI Models
- Model Analysis Tools
- The LTI Viewer
- Introduction
- Getting Started Using the LTI Viewer: An Example
- The LTI Viewer Menus
- The Right-Click Menus
- The LTI Viewer Tools Menu
- Simulink LTI Viewer
- Control Design Tools
- The Root Locus Design GUI
- Introduction
- A Servomechanism Example
- Controller Design Using the Root Locus Design GUI
- Additional Root Locus Design GUI Features
- References
- Design Case Studies
- Reliable Computations
- Reference
- Category Tables
- acker
- append
- augstate
- balreal
- bode
- c2d
- canon
- care
- chgunits
- connect
- covar
- ctrb
- ctrbf
- d2c
- d2d
- damp
- dare
- dcgain
- delay2z
- dlqr
- dlyap
- drmodel, drss
- dsort
- dss
- dssdata
- esort
- estim
- evalfr
- feedback
- filt
- frd
- frdata
- freqresp
- gensig
- get
- gram
- hasdelay
- impulse
- initial
- inv
- isct, isdt
- isempty
- isproper
- issiso
- kalman
- kalmd
- lft
- lqgreg
- lqr
- lqrd
- lqry
- lsim
- ltiview
- lyap
- margin
- minreal
- modred
- ndims
- ngrid
- nichols
- norm
- nyquist
- obsv
- obsvf
- ord2
- pade
- parallel
- place
- pole
- pzmap
- reg
- reshape
- rlocfind
- rlocus
- rltool
- rmodel, rss
- series
- set
- sgrid
- sigma
- size
- sminreal
- ss
- ss2ss
- ssbal
- ssdata
- stack
- step
- tf
- tfdata
- totaldelay
- zero
- zgrid
- zpk
- zpkdata
- Index

nyquist
11-156
11nyquist
Purpose Compute Nyquist frequency response of LTI models
Syntax nyquist(sys)
nyquist(sys,w)
nyquist(sys1,sys2,...,sysN)
nyquist(sys1,sys2,...,sysN,w)
nyquist(sys1,'PlotStyle1',...,sysN,'PlotStyleN')
[re,im,w] = nyquist(sys)
[re,im] = nyquist(sys,w)
Description nyquist calcula tes the Nyquist frequency response of LTI models. When
invoked wit hout left-hand arguments,
nyquist produces a Nyquist plot on the
screen. Nyquist plots are used to analyze system properties including gain
margin, phase margin, and stability.
nyquist(sys) plots the Nyquist response of an arbitrary LTI model sys.This
model can be continuous or discrete, and SISO or MIMO. In the MIMO case,
nyquist produces an array of Nyquist plots, each plot showing the response of
one particular I/O channel. The frequency points are chosen automatically
basedonthesystempolesandzeros.
nyquist(sys,w) explicitly specifies the frequency range or frequency points to
be used for the plot. To focus on a particular frequency interval
[wmin,wmax],
set
w = {wmin,wmax}. To use particular frequency points, set w to the vector of
desired frequencies. Use
logspace to generate logarithmically spaced
frequency vectors. Frequencies should be specified in rad/sec.
nyquist(sys1,sys2,...,sysN) or nyquist(sys1,sys2,...,sysN,w)
superimpos es the Nyquist plots of several LTI models on a single figure. All
systemsmust have the same number of inputs and outputs,but may otherwise
be a mix of continuous- and discrete-time systems. You can also specify a
distinctive color, linestyle, and/or marker for each system plot with the syntax
nyquist(sys1,'PlotStyle1',...,sysN,'PlotStyleN')
See bode for an example.