
User`s guide
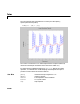
Table Of Contents
- Preface
- Quick Start
- LTI Models
- Introduction
- Creating LTI Models
- LTI Properties
- Model Conversion
- Time Delays
- Simulink Block for LTI Systems
- References
- Operations on LTI Models
- Arrays of LTI Models
- Model Analysis Tools
- The LTI Viewer
- Introduction
- Getting Started Using the LTI Viewer: An Example
- The LTI Viewer Menus
- The Right-Click Menus
- The LTI Viewer Tools Menu
- Simulink LTI Viewer
- Control Design Tools
- The Root Locus Design GUI
- Introduction
- A Servomechanism Example
- Controller Design Using the Root Locus Design GUI
- Additional Root Locus Design GUI Features
- References
- Design Case Studies
- Reliable Computations
- Reference
- Category Tables
- acker
- append
- augstate
- balreal
- bode
- c2d
- canon
- care
- chgunits
- connect
- covar
- ctrb
- ctrbf
- d2c
- d2d
- damp
- dare
- dcgain
- delay2z
- dlqr
- dlyap
- drmodel, drss
- dsort
- dss
- dssdata
- esort
- estim
- evalfr
- feedback
- filt
- frd
- frdata
- freqresp
- gensig
- get
- gram
- hasdelay
- impulse
- initial
- inv
- isct, isdt
- isempty
- isproper
- issiso
- kalman
- kalmd
- lft
- lqgreg
- lqr
- lqrd
- lqry
- lsim
- ltiview
- lyap
- margin
- minreal
- modred
- ndims
- ngrid
- nichols
- norm
- nyquist
- obsv
- obsvf
- ord2
- pade
- parallel
- place
- pole
- pzmap
- reg
- reshape
- rlocfind
- rlocus
- rltool
- rmodel, rss
- series
- set
- sgrid
- sigma
- size
- sminreal
- ss
- ss2ss
- ssbal
- ssdata
- stack
- step
- tf
- tfdata
- totaldelay
- zero
- zgrid
- zpk
- zpkdata
- Index

ltiview
11-133
11ltiview
Purpose Initialize an LTI Viewer for LTI system response analysis
Syntax ltiview
ltiview(plottype,sys)
ltiview(plottype,sys,extras)
ltiview(plottype,sys1,sys2,...sysN)
ltiview(plottype,sys1,sys2,...sysN,extras)
ltiview(plottype,sys1,PlotStyle1,sys2,PlotStyle2,...)
Description ltiview when invoked without input arguments, initializes a new LTI Viewer
for LTI system response analysis.
Only frequency-domain analysis functions can be applied to FRDs.
ltiview(plottype,sys) initializes an LTI Viewer containing the LTI
response type indicated by
plottype for the LTI model sys. The string
plottype can be any one of the following:
'step'
'impulse'
'initial'
'lsim'
'pzmap'
'bode'
'nyquist'
'nichols'
'sigma'
or, plottype can be a cell vector containing up to six of these plot types.
For example,
ltiview({'step';'nyquist'},sys)
displays the plots of both of these response types for a given system sys.
ltiview(plottype,sys,extras) allows the additional input arguments
supported by the various LTI model response functions to be passed to the
ltiview command.