
User`s guide
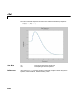
Table Of Contents
- Preface
- Quick Start
- LTI Models
- Introduction
- Creating LTI Models
- LTI Properties
- Model Conversion
- Time Delays
- Simulink Block for LTI Systems
- References
- Operations on LTI Models
- Arrays of LTI Models
- Model Analysis Tools
- The LTI Viewer
- Introduction
- Getting Started Using the LTI Viewer: An Example
- The LTI Viewer Menus
- The Right-Click Menus
- The LTI Viewer Tools Menu
- Simulink LTI Viewer
- Control Design Tools
- The Root Locus Design GUI
- Introduction
- A Servomechanism Example
- Controller Design Using the Root Locus Design GUI
- Additional Root Locus Design GUI Features
- References
- Design Case Studies
- Reliable Computations
- Reference
- Category Tables
- acker
- append
- augstate
- balreal
- bode
- c2d
- canon
- care
- chgunits
- connect
- covar
- ctrb
- ctrbf
- d2c
- d2d
- damp
- dare
- dcgain
- delay2z
- dlqr
- dlyap
- drmodel, drss
- dsort
- dss
- dssdata
- esort
- estim
- evalfr
- feedback
- filt
- frd
- frdata
- freqresp
- gensig
- get
- gram
- hasdelay
- impulse
- initial
- inv
- isct, isdt
- isempty
- isproper
- issiso
- kalman
- kalmd
- lft
- lqgreg
- lqr
- lqrd
- lqry
- lsim
- ltiview
- lyap
- margin
- minreal
- modred
- ndims
- ngrid
- nichols
- norm
- nyquist
- obsv
- obsvf
- ord2
- pade
- parallel
- place
- pole
- pzmap
- reg
- reshape
- rlocfind
- rlocus
- rltool
- rmodel, rss
- series
- set
- sgrid
- sigma
- size
- sminreal
- ss
- ss2ss
- ssbal
- ssdata
- stack
- step
- tf
- tfdata
- totaldelay
- zero
- zgrid
- zpk
- zpkdata
- Index

bode
11-23
structure. The reduction to Hessenberg form provides a good compromise
between efficiency and reliability. See [1] for more details on this technique.
For discrete-time systems, the frequency response is obtained by evaluating
the transfer function on the unit circle. To facilitate interpretation, the
upper-half of the unit circle is parametrized as
where is the sample time. is called the Nyquist frequency.The
equivalent “continuous-time frequency” is then used as the -axis variable.
Because
is periodic with period ,
bode plots the response only up t o the Nyquist
frequency . If the sample time is unspecified, the default value is
assumed.
Diagnostics If t he system has a pole on the axis (or unit circle in the discrete case) and
w happens t o contain this frequency point, the gain is infinite, is
singular, and
bode produces t he warning message
Singularity in freq. response due to jw-axis or unit circle pole.
See Also evalfr Response at single complex frequency
freqresp Frequency response computation
ltiview LTIsystemviewer
nichols Nichols plot
nyquist Ny quist plot
sigma Singular value plot
References [1] Laub, A.J., “Efficient Multivariable Frequency Response Computations,”
IEEE Transactions on Automatic Control, AC-26 (1981), pp. 4 07–408.
Hz
()
ze
jωT
s
= ,0ωω
N
≤≤
π
T
s
------=
T
s
ω
N
ω
x
He
jωT
s
()
2
ω
N
ω
N
T
s
1
=
j
ω
j
ω
IA
–