
User`s guide

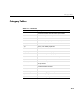
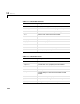
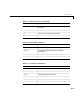
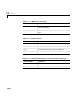
Table Of Contents
- Preface
- Quick Start
- LTI Models
- Introduction
- Creating LTI Models
- LTI Properties
- Model Conversion
- Time Delays
- Simulink Block for LTI Systems
- References
- Operations on LTI Models
- Arrays of LTI Models
- Model Analysis Tools
- The LTI Viewer
- Introduction
- Getting Started Using the LTI Viewer: An Example
- The LTI Viewer Menus
- The Right-Click Menus
- The LTI Viewer Tools Menu
- Simulink LTI Viewer
- Control Design Tools
- The Root Locus Design GUI
- Introduction
- A Servomechanism Example
- Controller Design Using the Root Locus Design GUI
- Additional Root Locus Design GUI Features
- References
- Design Case Studies
- Reliable Computations
- Reference
- Category Tables
- acker
- append
- augstate
- balreal
- bode
- c2d
- canon
- care
- chgunits
- connect
- covar
- ctrb
- ctrbf
- d2c
- d2d
- damp
- dare
- dcgain
- delay2z
- dlqr
- dlyap
- drmodel, drss
- dsort
- dss
- dssdata
- esort
- estim
- evalfr
- feedback
- filt
- frd
- frdata
- freqresp
- gensig
- get
- gram
- hasdelay
- impulse
- initial
- inv
- isct, isdt
- isempty
- isproper
- issiso
- kalman
- kalmd
- lft
- lqgreg
- lqr
- lqrd
- lqry
- lsim
- ltiview
- lyap
- margin
- minreal
- modred
- ndims
- ngrid
- nichols
- norm
- nyquist
- obsv
- obsvf
- ord2
- pade
- parallel
- place
- pole
- pzmap
- reg
- reshape
- rlocfind
- rlocus
- rltool
- rmodel, rss
- series
- set
- sgrid
- sigma
- size
- sminreal
- ss
- ss2ss
- ssbal
- ssdata
- stack
- step
- tf
- tfdata
- totaldelay
- zero
- zgrid
- zpk
- zpkdata
- Index

11 Reference
11-8
ltiview
Open the LTI Viewer for linear response analysis.
step
Calculate step r esponse.
Table 11-9: Frequency Response
Function Name Description
bode
Calculatebodeplot.
evalfr
Evaluate r es p onse at sing le complex frequency.
freqresp
Evaluate freque n cy response for s el ected
frequencies.
linspace
Create a vector of evenly spaced frequencies.
logspace
Create a vector of logarithmically spaced
frequencies.
ltiview
Open the LTI Viewer for linear response analysis.
margin
Calculate g ain and phase margins.
ngrid
Superimpose grid lines on a Nichols pl ot .
nichols
Calculate N ichols plot.
nyquist
Calculate Nyquis t plot.
pzmap
Calculate pole/zero map.
rlocus
Calculate root locus.
rlocfind
Find gain/pole on root locus.
rltool
Open Root Locus Design GUI.
sgrid
Superimpos e s-plane grid o n root loc us or pole/zero
map.
Table 11-8: Time Response (Continued)
Function Name Description