
User`s guide
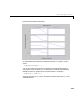
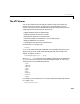

Table Of Contents
- Preface
- Quick Start
- LTI Models
- Introduction
- Creating LTI Models
- LTI Properties
- Model Conversion
- Time Delays
- Simulink Block for LTI Systems
- References
- Operations on LTI Models
- Arrays of LTI Models
- Model Analysis Tools
- The LTI Viewer
- Introduction
- Getting Started Using the LTI Viewer: An Example
- The LTI Viewer Menus
- The Right-Click Menus
- The LTI Viewer Tools Menu
- Simulink LTI Viewer
- Control Design Tools
- The Root Locus Design GUI
- Introduction
- A Servomechanism Example
- Controller Design Using the Root Locus Design GUI
- Additional Root Locus Design GUI Features
- References
- Design Case Studies
- Reliable Computations
- Reference
- Category Tables
- acker
- append
- augstate
- balreal
- bode
- c2d
- canon
- care
- chgunits
- connect
- covar
- ctrb
- ctrbf
- d2c
- d2d
- damp
- dare
- dcgain
- delay2z
- dlqr
- dlyap
- drmodel, drss
- dsort
- dss
- dssdata
- esort
- estim
- evalfr
- feedback
- filt
- frd
- frdata
- freqresp
- gensig
- get
- gram
- hasdelay
- impulse
- initial
- inv
- isct, isdt
- isempty
- isproper
- issiso
- kalman
- kalmd
- lft
- lqgreg
- lqr
- lqrd
- lqry
- lsim
- ltiview
- lyap
- margin
- minreal
- modred
- ndims
- ngrid
- nichols
- norm
- nyquist
- obsv
- obsvf
- ord2
- pade
- parallel
- place
- pole
- pzmap
- reg
- reshape
- rlocfind
- rlocus
- rltool
- rmodel, rss
- series
- set
- sgrid
- sigma
- size
- sminreal
- ss
- ss2ss
- ssbal
- ssdata
- stack
- step
- tf
- tfdata
- totaldelay
- zero
- zgrid
- zpk
- zpkdata
- Index

The LTI Viewer
1-17
The LTI Viewer
You can also analyze time and frequency domain responses using the LTI
Viewer; see “The LTI Viewer” on page 6-1 for more information. The LTI
Viewer isan interactive user interface that assists you with the analysis of LTI
model responses by facilitating such functions as:
• Toggli ng between types of response plots
• Plott ing response s of several LTI models
• Zooming into regions of the response plots
• Calculating response characteristics, such as settling time
• Displaying different I/O channels
• Changing the plot styles of the response plots
To initialize an LTI Viewer, type
ltiview
ltiview
can also be called with additional inp ut arguments that allow you to
specify the type of LTI model response displ aye d when the window is first
opened . The generic syntax is
ltiview(plottype,sys1,...,sysn)
wheresys1,...,sysn arenamesof LTImodelsin theMATLABworkspaceand
plottype is either a string for one of the f ollowing plot types, or a cell array,
containing up to six of the following strings
'step'
'impulse'
'initial'
'lsim'
'pzmap'
'bode'
'nyquist'
'nichols'
'sigma'
For example, you can initialize an LTI Viewer showing the step response of the
LTI model
sys by
ltiview('step',sys)