
User`s guide
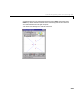
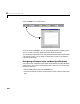
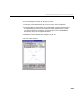
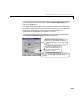
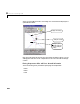
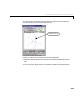
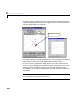
Table Of Contents
- Preface
- Quick Start
- LTI Models
- Introduction
- Creating LTI Models
- LTI Properties
- Model Conversion
- Time Delays
- Simulink Block for LTI Systems
- References
- Operations on LTI Models
- Arrays of LTI Models
- Model Analysis Tools
- The LTI Viewer
- Introduction
- Getting Started Using the LTI Viewer: An Example
- The LTI Viewer Menus
- The Right-Click Menus
- The LTI Viewer Tools Menu
- Simulink LTI Viewer
- Control Design Tools
- The Root Locus Design GUI
- Introduction
- A Servomechanism Example
- Controller Design Using the Root Locus Design GUI
- Additional Root Locus Design GUI Features
- References
- Design Case Studies
- Reliable Computations
- Reference
- Category Tables
- acker
- append
- augstate
- balreal
- bode
- c2d
- canon
- care
- chgunits
- connect
- covar
- ctrb
- ctrbf
- d2c
- d2d
- damp
- dare
- dcgain
- delay2z
- dlqr
- dlyap
- drmodel, drss
- dsort
- dss
- dssdata
- esort
- estim
- evalfr
- feedback
- filt
- frd
- frdata
- freqresp
- gensig
- get
- gram
- hasdelay
- impulse
- initial
- inv
- isct, isdt
- isempty
- isproper
- issiso
- kalman
- kalmd
- lft
- lqgreg
- lqr
- lqrd
- lqry
- lsim
- ltiview
- lyap
- margin
- minreal
- modred
- ndims
- ngrid
- nichols
- norm
- nyquist
- obsv
- obsvf
- ord2
- pade
- parallel
- place
- pole
- pzmap
- reg
- reshape
- rlocfind
- rlocus
- rltool
- rmodel, rss
- series
- set
- sgrid
- sigma
- size
- sminreal
- ss
- ss2ss
- ssbal
- ssdata
- stack
- step
- tf
- tfdata
- totaldelay
- zero
- zgrid
- zpk
- zpkdata
- Index

8 The Root Locus Design GUI
8-28
The default mode for the toolbar is the drag mode. In this mode, you can:
• Click on a specific location on the root locus to place a closed-loop pole there
(and consequently reassign the gain set point).
• Drag any of the closed-loop poles along its branch of the root locus (also
reassigning the gain set point).
• Drag any of the compensator poles or zeros around the complex plane to
change the compensator.
To add a complex conjugate compensator pole pair on the root locus plot:
1 Select the add pole button (the second button in the root locus toolbar).
2 Click onthe plotregion whereyou wouldlike to addone ofthe complexpoles.
Some of the features of using the root locus toolbar to add a pole are:
• While the add pole button is depressed, the cursor changes to an arrow with
an
x at its tip whenever it is over the plot region. This indicates the toolbar
is in the “add pole” mode.
• After you add the poles, the add pole button pops b ack up and the default
drag mode is restored. The added compensator poles appear in a different
color. The default color is red.
• The LTI Viewer response plots change as soon as the pole is added.
• The text displayed in the
Current Compensator region of the GUI now
displays the new pair of poles.