
User`s guide
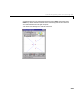
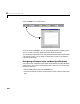
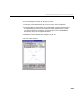
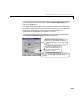
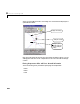
Table Of Contents
- Preface
- Quick Start
- LTI Models
- Introduction
- Creating LTI Models
- LTI Properties
- Model Conversion
- Time Delays
- Simulink Block for LTI Systems
- References
- Operations on LTI Models
- Arrays of LTI Models
- Model Analysis Tools
- The LTI Viewer
- Introduction
- Getting Started Using the LTI Viewer: An Example
- The LTI Viewer Menus
- The Right-Click Menus
- The LTI Viewer Tools Menu
- Simulink LTI Viewer
- Control Design Tools
- The Root Locus Design GUI
- Introduction
- A Servomechanism Example
- Controller Design Using the Root Locus Design GUI
- Additional Root Locus Design GUI Features
- References
- Design Case Studies
- Reliable Computations
- Reference
- Category Tables
- acker
- append
- augstate
- balreal
- bode
- c2d
- canon
- care
- chgunits
- connect
- covar
- ctrb
- ctrbf
- d2c
- d2d
- damp
- dare
- dcgain
- delay2z
- dlqr
- dlyap
- drmodel, drss
- dsort
- dss
- dssdata
- esort
- estim
- evalfr
- feedback
- filt
- frd
- frdata
- freqresp
- gensig
- get
- gram
- hasdelay
- impulse
- initial
- inv
- isct, isdt
- isempty
- isproper
- issiso
- kalman
- kalmd
- lft
- lqgreg
- lqr
- lqrd
- lqry
- lsim
- ltiview
- lyap
- margin
- minreal
- modred
- ndims
- ngrid
- nichols
- norm
- nyquist
- obsv
- obsvf
- ord2
- pade
- parallel
- place
- pole
- pzmap
- reg
- reshape
- rlocfind
- rlocus
- rltool
- rmodel, rss
- series
- set
- sgrid
- sigma
- size
- sminreal
- ss
- ss2ss
- ssbal
- ssdata
- stack
- step
- tf
- tfdata
- totaldelay
- zero
- zgrid
- zpk
- zpkdata
- Index
8 The Root Locus Design GUI
8-24
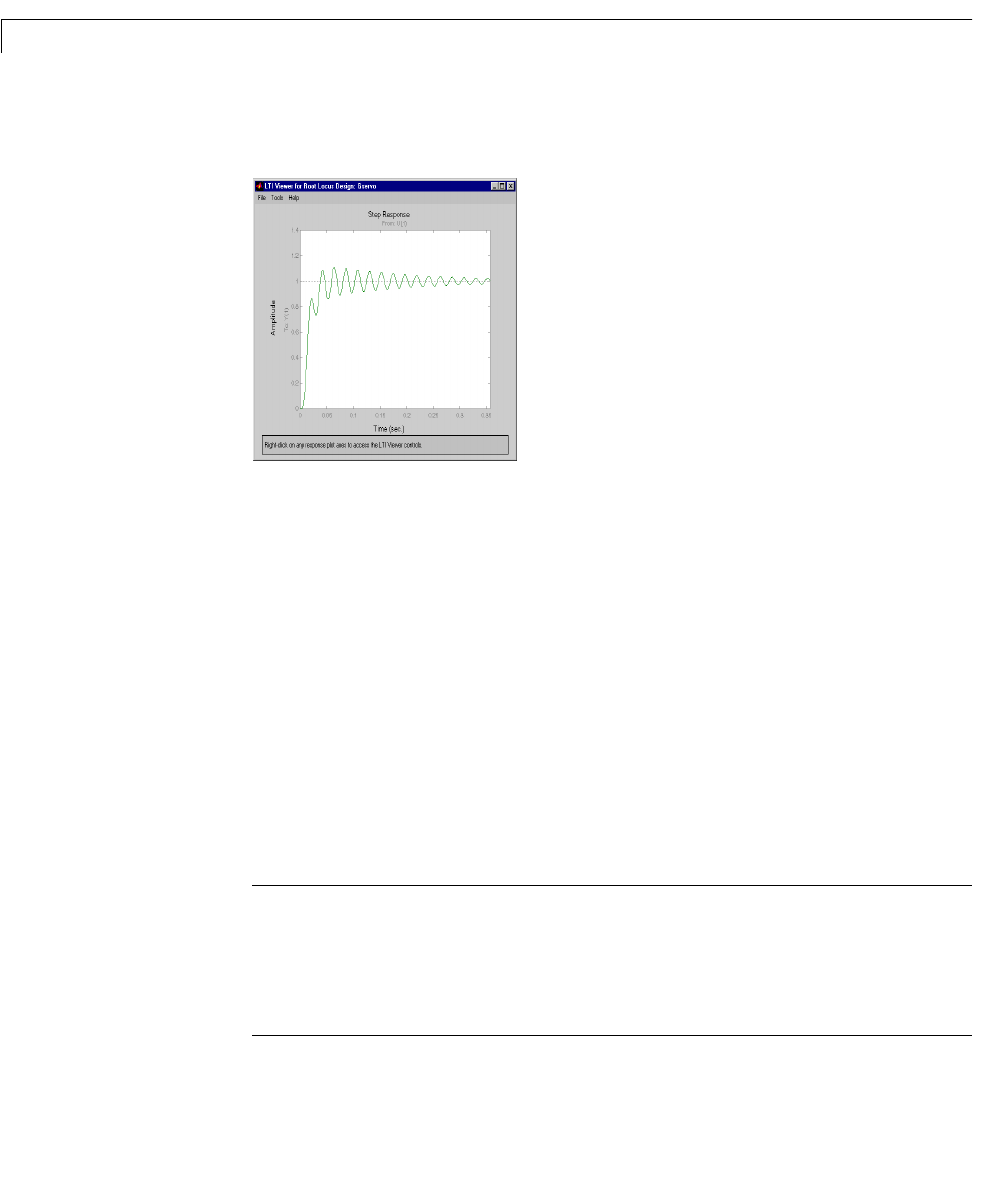
The step response plot on the dynamically linked LTI Viewer automatically
updates when you release the mouse button.
As you may have noticed, the response time decreases with increasing gain,
while the overshoot increases. Here we no longer meet the overshoot
requirement. Since this gain is already relatively large, it’s likely that we will
not be able to meet both design requirements using only a gain for the
compensator. This conjecture is supported when you specify the design region
boundaries on the root locus for these design requirements. We do this in the
next subsection.
Specifying Design Region Boundaries on the Root Locus
If, as in our example, your design criteria are specified in terms of step
response characteristics, you may want to use the grid and boundary
constraintoptions thatareaccessible fromthe
AddGrid/Boundary menuitem
in the
Tools menu on the Root Locus Design GUI. These options allow you to
use second order system design criteria to inscribe the boundaries of design
region directly on the root locus plot, or apply a grid to the plot.
Note: The bounda ries yo u app ly to the Root L ocus Des ign GUI bas ed o n LT I
system design criteria (settl ing time, damp ing rati o, n atural fr equency, and
peak overshoot) are computed relative to second-order systems only.
Theref o re, for highe r ord er s y stem s, the se boun dar ies prov ide app rox ima tio ns
to the design r egio n.