
User`s guide
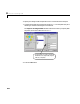
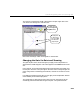
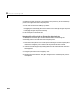
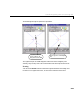
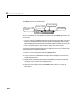
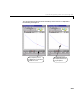
Table Of Contents
- Preface
- Quick Start
- LTI Models
- Introduction
- Creating LTI Models
- LTI Properties
- Model Conversion
- Time Delays
- Simulink Block for LTI Systems
- References
- Operations on LTI Models
- Arrays of LTI Models
- Model Analysis Tools
- The LTI Viewer
- Introduction
- Getting Started Using the LTI Viewer: An Example
- The LTI Viewer Menus
- The Right-Click Menus
- The LTI Viewer Tools Menu
- Simulink LTI Viewer
- Control Design Tools
- The Root Locus Design GUI
- Introduction
- A Servomechanism Example
- Controller Design Using the Root Locus Design GUI
- Additional Root Locus Design GUI Features
- References
- Design Case Studies
- Reliable Computations
- Reference
- Category Tables
- acker
- append
- augstate
- balreal
- bode
- c2d
- canon
- care
- chgunits
- connect
- covar
- ctrb
- ctrbf
- d2c
- d2d
- damp
- dare
- dcgain
- delay2z
- dlqr
- dlyap
- drmodel, drss
- dsort
- dss
- dssdata
- esort
- estim
- evalfr
- feedback
- filt
- frd
- frdata
- freqresp
- gensig
- get
- gram
- hasdelay
- impulse
- initial
- inv
- isct, isdt
- isempty
- isproper
- issiso
- kalman
- kalmd
- lft
- lqgreg
- lqr
- lqrd
- lqry
- lsim
- ltiview
- lyap
- margin
- minreal
- modred
- ndims
- ngrid
- nichols
- norm
- nyquist
- obsv
- obsvf
- ord2
- pade
- parallel
- place
- pole
- pzmap
- reg
- reshape
- rlocfind
- rlocus
- rltool
- rmodel, rss
- series
- set
- sgrid
- sigma
- size
- sminreal
- ss
- ss2ss
- ssbal
- ssdata
- stack
- step
- tf
- tfdata
- totaldelay
- zero
- zgrid
- zpk
- zpkdata
- Index
8 The Root Locus Design GUI
8-20
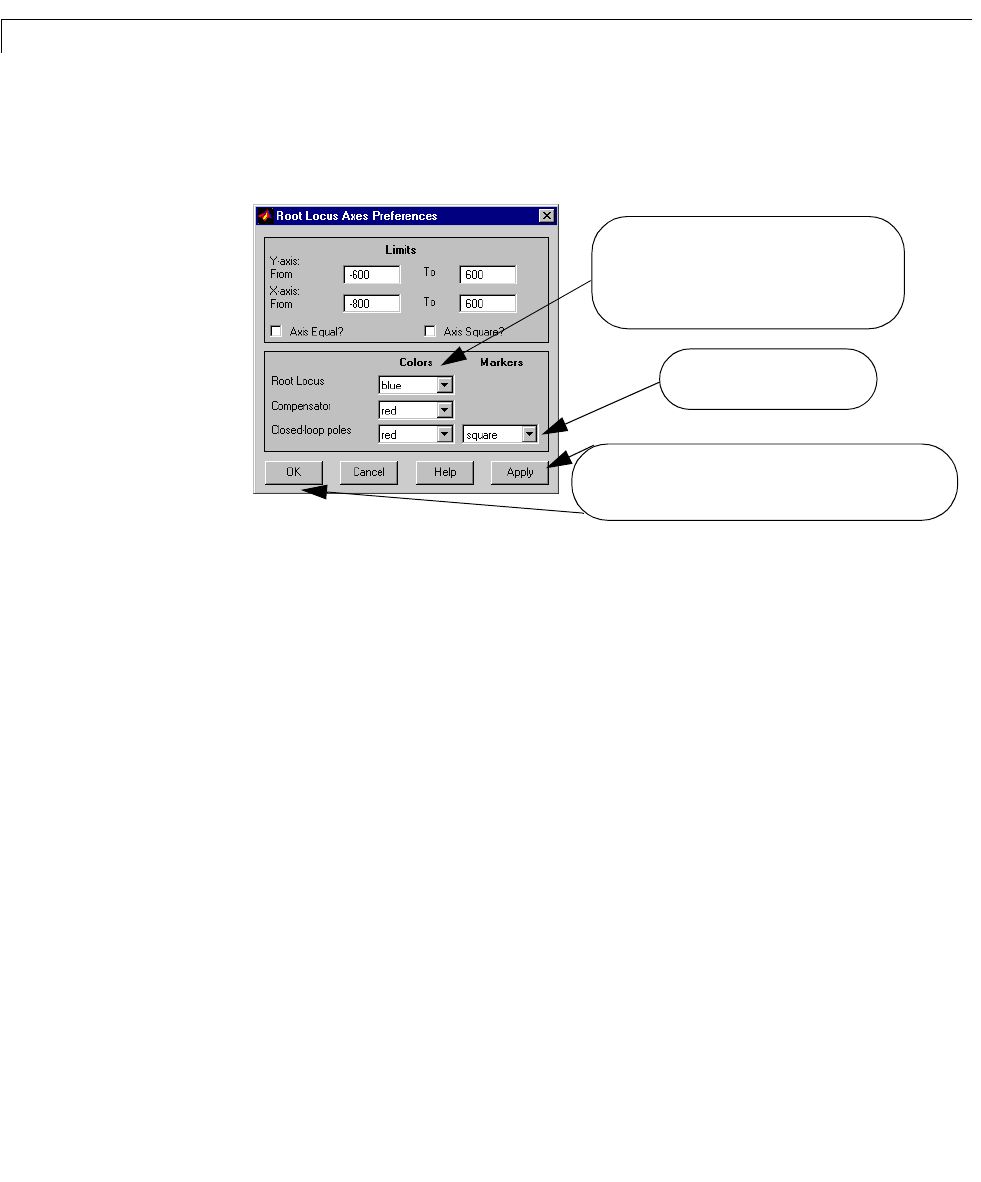
You can also set or revise axes limits and other axes preferences in the Root
Locus Axes Preferences
window. To open this window, select Set Axes
Preferences
from the Tools menu.
If you have already stored axes limits using
Axes settings, these limits appear
in this window in the
Limits field. You can reset these limits by typing in new
values. To apply any changes to the entries in this window, click on
OK after
making t he changes.
Displaying System Responses
Before you design your compensator, you may want to conduct some response
analysis of your c losed-loop system evaluate d at a fixed value of the gain.
You can acce s s s o me o f the s ys te m response analysis capabilities o f the LTI
Viewer (see Chapter 6, “The LTI Viewer”) through the checkboxes located in
the lower portion of the Root Locus Design GUI. Checking one or several of
theseboxesopensanLTIViewerwindowthatdisplaysthecorrespondingplots.
The LTI Viewer window that opens is dyn amically l inke d to the Root Locus
Design GUI: any changes made to the system on the GUI that affect the gain
set point will effect a corresponding change on the displayed LTI Viewer plots.
For this example, we want to know if the step response meets our design
criteria. The current value for the gain set p oint is abo u t 44. Clearly this value
of the gain would test the limits of stability o f our system. Let’s cho os e a
reasonable value for the gain (say, 20) a nd look at the step response .
You can also use this window to change the
colors of the root locus plot and the compen-
sator poles and zeros, and the color and type
of marker used for the closed-loop poles.
Type of marker used to desig-
nate the closed-loop poles
Select Apply to implement changes and keep this window
open. Select
OK to implement changes and close the window.