
User`s guide
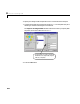
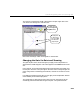
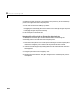
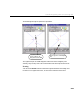
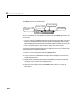
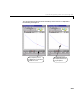
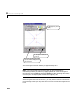
Table Of Contents
- Preface
- Quick Start
- LTI Models
- Introduction
- Creating LTI Models
- LTI Properties
- Model Conversion
- Time Delays
- Simulink Block for LTI Systems
- References
- Operations on LTI Models
- Arrays of LTI Models
- Model Analysis Tools
- The LTI Viewer
- Introduction
- Getting Started Using the LTI Viewer: An Example
- The LTI Viewer Menus
- The Right-Click Menus
- The LTI Viewer Tools Menu
- Simulink LTI Viewer
- Control Design Tools
- The Root Locus Design GUI
- Introduction
- A Servomechanism Example
- Controller Design Using the Root Locus Design GUI
- Additional Root Locus Design GUI Features
- References
- Design Case Studies
- Reliable Computations
- Reference
- Category Tables
- acker
- append
- augstate
- balreal
- bode
- c2d
- canon
- care
- chgunits
- connect
- covar
- ctrb
- ctrbf
- d2c
- d2d
- damp
- dare
- dcgain
- delay2z
- dlqr
- dlyap
- drmodel, drss
- dsort
- dss
- dssdata
- esort
- estim
- evalfr
- feedback
- filt
- frd
- frdata
- freqresp
- gensig
- get
- gram
- hasdelay
- impulse
- initial
- inv
- isct, isdt
- isempty
- isproper
- issiso
- kalman
- kalmd
- lft
- lqgreg
- lqr
- lqrd
- lqry
- lsim
- ltiview
- lyap
- margin
- minreal
- modred
- ndims
- ngrid
- nichols
- norm
- nyquist
- obsv
- obsvf
- ord2
- pade
- parallel
- place
- pole
- pzmap
- reg
- reshape
- rlocfind
- rlocus
- rltool
- rmodel, rss
- series
- set
- sgrid
- sigma
- size
- sminreal
- ss
- ss2ss
- ssbal
- ssdata
- stack
- step
- tf
- tfdata
- totaldelay
- zero
- zgrid
- zpk
- zpkdata
- Index
Controller Design Using the Root Locus Design GUI
8-13
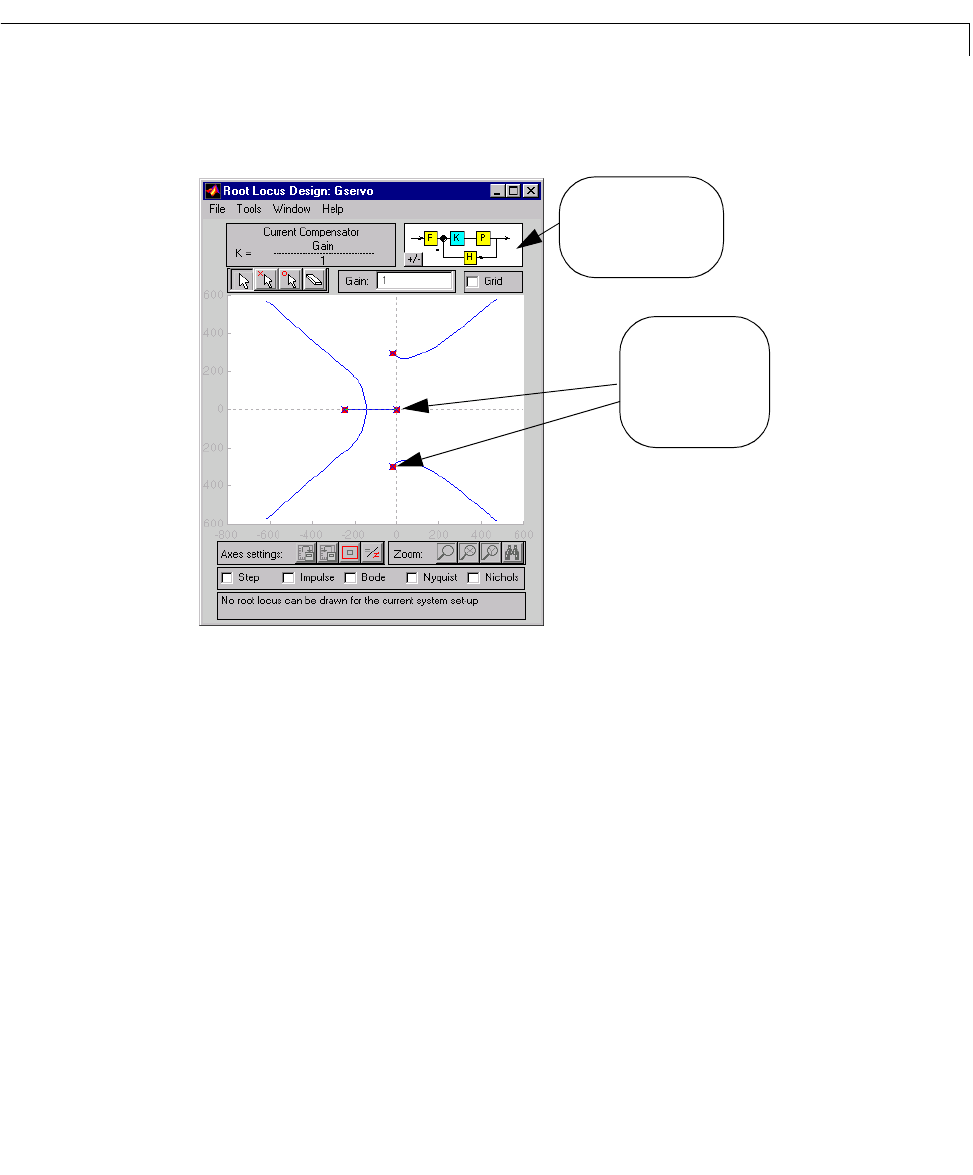
The root locus of the design model is displayed in the plot region of the GUI.
Your Root Locus Design GUI looks like this.
Notice that the design model name appears in the title bar.
Changing the Gain Set Point and Zooming
The gain set point isthevalueofthegainyouapplytothecompensatorto
determine the closed-loop poles.This valueappears inthe
Gain text boxon the
GUI.
Inthis section,weusesomeofthe basicfunctionsof the RootLocusDesign GUI
to analyze a root locus in the plot region. We cover how to change the gain set
point, along with the closed-loop pole locations, and how to use the GUI zoom
tools.
Let’s begin by seeing how much gain you can apply to the compensator and still
retain stability of the closed-loop system.
The red squares on each branch of the root locus mark the locations of the
closed-loop poles associated with the gain set point. The s ystem becomes
.
The (red) squares
are the closed-loop
poles corresponding
to the value of the
compensator gain.
The feedback structure
selected in the
Import LTI
Design Model window