
User`s guide
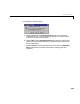
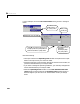
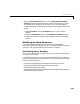
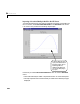
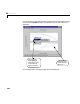
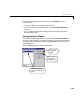

Table Of Contents
- Preface
- Quick Start
- LTI Models
- Introduction
- Creating LTI Models
- LTI Properties
- Model Conversion
- Time Delays
- Simulink Block for LTI Systems
- References
- Operations on LTI Models
- Arrays of LTI Models
- Model Analysis Tools
- The LTI Viewer
- Introduction
- Getting Started Using the LTI Viewer: An Example
- The LTI Viewer Menus
- The Right-Click Menus
- The LTI Viewer Tools Menu
- Simulink LTI Viewer
- Control Design Tools
- The Root Locus Design GUI
- Introduction
- A Servomechanism Example
- Controller Design Using the Root Locus Design GUI
- Additional Root Locus Design GUI Features
- References
- Design Case Studies
- Reliable Computations
- Reference
- Category Tables
- acker
- append
- augstate
- balreal
- bode
- c2d
- canon
- care
- chgunits
- connect
- covar
- ctrb
- ctrbf
- d2c
- d2d
- damp
- dare
- dcgain
- delay2z
- dlqr
- dlyap
- drmodel, drss
- dsort
- dss
- dssdata
- esort
- estim
- evalfr
- feedback
- filt
- frd
- frdata
- freqresp
- gensig
- get
- gram
- hasdelay
- impulse
- initial
- inv
- isct, isdt
- isempty
- isproper
- issiso
- kalman
- kalmd
- lft
- lqgreg
- lqr
- lqrd
- lqry
- lsim
- ltiview
- lyap
- margin
- minreal
- modred
- ndims
- ngrid
- nichols
- norm
- nyquist
- obsv
- obsvf
- ord2
- pade
- parallel
- place
- pole
- pzmap
- reg
- reshape
- rlocfind
- rlocus
- rltool
- rmodel, rss
- series
- set
- sgrid
- sigma
- size
- sminreal
- ss
- ss2ss
- ssbal
- ssdata
- stack
- step
- tf
- tfdata
- totaldelay
- zero
- zgrid
- zpk
- zpkdata
- Index

Simulink LTI Viewer
6-63
You can viewthe linearizedmodels in the LTIViewerworkspaceor chang ethe
plot type using the right-click menus. See “The Right-Click Menus” on page
6-18 for more information.
Analyzing the Bode Plot of the Linearized Analysis Model
To analyze the Bode p lot f or this mod el,
1 Right-click anywhere in the plot region.
2 Se le ct t he Plot Type menu, and then the Bode subm enu item.
Specifying Another Analysis Model
Once an analysis model is specified on a Simulink diagram, you can specify
other analysis models from the same Simulink diagram in one of the following
three ways:
• Modify any of the model parameters.
• Change the operating conditions.
• Change the location of any of the Input Point or Output Point blocks.
For the van der Pol example, we want to create a second analysis model by
modifying a model parameter. Specifically, we modify the Gain block labeled
Mu.Todothis:
•Return to theSimulink model, and open the
Mu Gain blockby double-clicking
on it.
• Change the gain to 10; click on
OK.
Comparing the Bode Plots of the Two Linearized Analysis Models
Having just specified a new analysis model, let’s load its linearization into the
LTI Viewer and compare the Bode plots of the two models. To do this, reselect
the
Get Linearized Model menu item under Simulink on the LTI Viewer.