
User`s guide
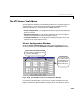
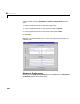
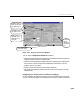
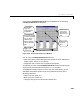
Table Of Contents
- Preface
- Quick Start
- LTI Models
- Introduction
- Creating LTI Models
- LTI Properties
- Model Conversion
- Time Delays
- Simulink Block for LTI Systems
- References
- Operations on LTI Models
- Arrays of LTI Models
- Model Analysis Tools
- The LTI Viewer
- Introduction
- Getting Started Using the LTI Viewer: An Example
- The LTI Viewer Menus
- The Right-Click Menus
- The LTI Viewer Tools Menu
- Simulink LTI Viewer
- Control Design Tools
- The Root Locus Design GUI
- Introduction
- A Servomechanism Example
- Controller Design Using the Root Locus Design GUI
- Additional Root Locus Design GUI Features
- References
- Design Case Studies
- Reliable Computations
- Reference
- Category Tables
- acker
- append
- augstate
- balreal
- bode
- c2d
- canon
- care
- chgunits
- connect
- covar
- ctrb
- ctrbf
- d2c
- d2d
- damp
- dare
- dcgain
- delay2z
- dlqr
- dlyap
- drmodel, drss
- dsort
- dss
- dssdata
- esort
- estim
- evalfr
- feedback
- filt
- frd
- frdata
- freqresp
- gensig
- get
- gram
- hasdelay
- impulse
- initial
- inv
- isct, isdt
- isempty
- isproper
- issiso
- kalman
- kalmd
- lft
- lqgreg
- lqr
- lqrd
- lqry
- lsim
- ltiview
- lyap
- margin
- minreal
- modred
- ndims
- ngrid
- nichols
- norm
- nyquist
- obsv
- obsvf
- ord2
- pade
- parallel
- place
- pole
- pzmap
- reg
- reshape
- rlocfind
- rlocus
- rltool
- rmodel, rss
- series
- set
- sgrid
- sigma
- size
- sminreal
- ss
- ss2ss
- ssbal
- ssdata
- stack
- step
- tf
- tfdata
- totaldelay
- zero
- zgrid
- zpk
- zpkdata
- Index
6 The LTI Viewer
6-46
You can designate that the chosen preference (color, marker, or linestyle)
distinguish the plotted response curves by any (or all) of the following.
•
Systems: The line properties vary with the models.
•
Inputs: The line properties vary with the input channels.
•
Outputs: The line properties vary with the output channels.
•
Channels: The line properties vary with the I/O channels.
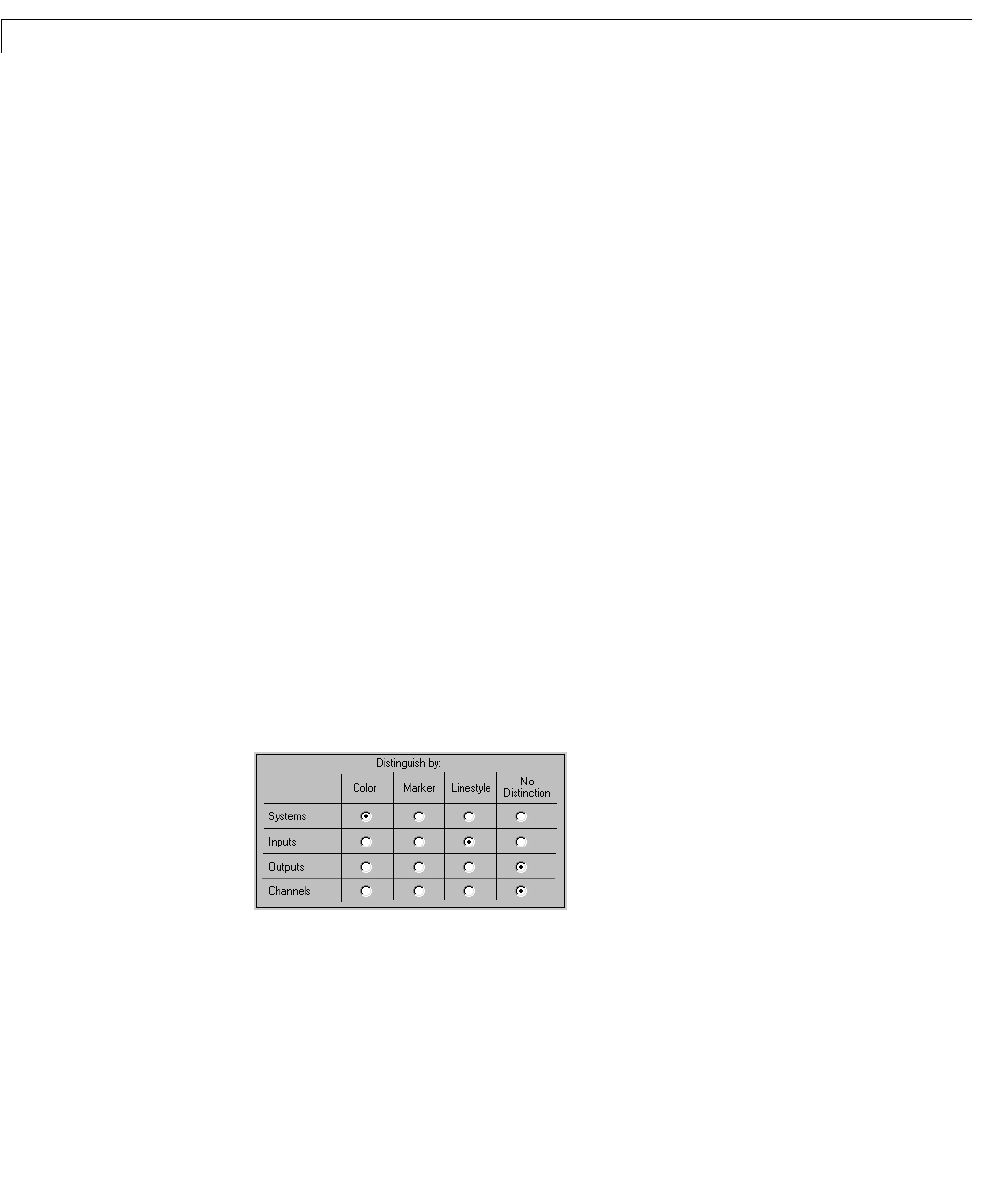
Changing the Response Curve Linestyle Properties
You can use t he radio buttons in the Distinguish b y field of t he Linestyle
Preferences
window t o vary a line property by model, input, output, or I/O
channel.
Whenyouopenthe
Linestyle Prefe rence s window, the radio button in the
Systems row a nd Color column of the Distinguis h by field is selected and the
radio buttonsin the
No Distinction column areselectedintheremaining rows.
This is the default setting for the plot styles used f or all of the response plots.
For example, to distinguish the responses from different inputs of a MIMO
model using different linestyles (in addition to distinguishing multiple models
by color):
1 Sele ct the rad io button in the Inputs row and Lines tyle column.
As soo n as you selec t this r ad io butto n, the previously sel ected rad io button
in the
Inputs rowisturnedoff,asshowninthefigurebelow.
The ra dio buttons are mutual ly exclusive along each row and each column
with the exception of the
No Distinction column. In other words, you can
use only one line property to distinguish the different systems, inputs,
outputs, or channels, and that same property cannot be applied to any other
row of t he
Linestyle Prefere nces window.